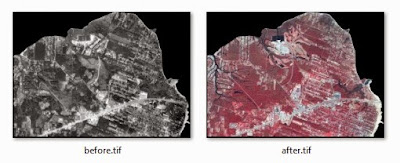
We're going to start with two aerial images taken several years apart. We'll subtract the before image from the after image and and visualize the result using a color ramp.
 |
| The before and after aerial photos we'll use for this recipe. Click for a larger version. |
Getting ready
You will need a data directory to store the source images. I usually create a directory named qgis_data for these types of experiments. You can download the two images used in this example from https://github.com/GeospatialPython/qgis/blob/gh-pages/change-detection.zip?raw=true and put them in a directory named change-detection in the rasters directory of your qgis_data directory. Note that the file is 55 megabytes, so it may take several minutes to download. Also, we'll step through this script a few lines at a time. It's meant to be run in the QGIS Python Console. You can download the entire script here: https://github.com/GeospatialPython/qgis/raw/master/4985_08_15-change.py
How to do it...
We'll use the QGIS raster calculator to subtract the images in order to get the difference, which will highlight significant changes. We'll also add a color ramp shader to the output in order to visualize the changes. To do this, we need to perform the following steps:
First, we need to import the libraries that we need in to the QGIS console:
from PyQt4.QtGui import *
from PyQt4.QtCore import *
from qgis.analysis import *
Now, we'll set up the path names and raster names for our images:
before = "/Users/joellawhead/qgis_data/rasters/change-detection/before.tif"
|after = "/Users/joellawhead/qgis_data/rasters/change-detection/after.tif"
beforeName = "Before"
afterName = "After"
Next, we'll establish our images as raster layers:
beforeRaster = QgsRasterLayer(before, beforeName)
afterRaster = QgsRasterLayer(after, afterName)
Then, we can build the calculator entries:
beforeEntry = QgsRasterCalculatorEntry()
afterEntry = QgsRasterCalculatorEntry()
beforeEntry.raster = beforeRaster
afterEntry.raster = afterRaster
beforeEntry.bandNumber = 1
afterEntry.bandNumber = 2
beforeEntry.ref = beforeName + "@1"
afterEntry.ref = afterName + "@2"
entries = [afterEntry, beforeEntry]
Now, we'll set up the simple expression that does the math for remote sensing:
exp = "%s - %s" % (afterEntry.ref, beforeEntry.ref)
Then, we can set up the output file path, the raster extent, and pixel width and height:
output = "/Users/joellawhead/qgis_data/rasters/change-detection/change.tif"
e = beforeRaster.extent()
w = beforeRaster.width()
h = beforeRaster.height()
Now, we perform the calculation:
change = QgsRasterCalculator(exp, output, "GTiff", e, w, h, entries)
change.processCalculation()
Finally, we'll load the output as a layer, create the color ramp shader, apply it to the layer, and add it to the map, as shown here:
lyr = QgsRasterLayer(output, "Change")
algorithm = QgsContrastEnhancement.StretchToMinimumMaximum
limits = QgsRaster.ContrastEnhancementMinMax
lyr.setContrastEnhancement(algorithm, limits)
s = QgsRasterShader()
c = QgsColorRampShader()
c.setColorRampType(QgsColorRampShader.INTERPOLATED)
i = []
qri = QgsColorRampShader.ColorRampItem
i.append(qri(0, QColor(0,0,0,0), 'NODATA'))
i.append(qri(-101, QColor(123,50,148,255), 'Significant Itensity Decrease'))
i.append(qri(-42.2395, QColor(194,165,207,255), 'Minor Itensity Decrease'))
i.append(qri(16.649, QColor(247,247,247,0), 'No Change'))
i.append(qri(75.5375, QColor(166,219,160,255), 'Minor Itensity Increase'))
i.append(qri(135, QColor(0,136,55,255), 'Significant Itensity Increase'))
c.setColorRampItemList(i)
s.setRasterShaderFunction(c)
ps = QgsSingleBandPseudoColorRenderer(lyr.dataProvider(), 1, s)
lyr.setRenderer(ps)
QgsMapLayerRegistry.instance().addMapLayer(lyr)
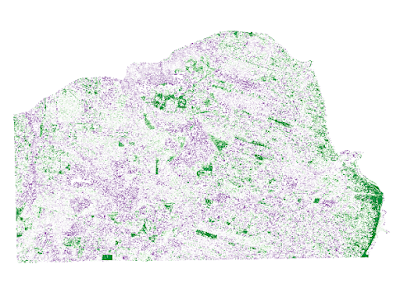
You should end up with the following image. As a general rule of thumb, green shows area of change where something was built or trees were removed, and purple areas show where a road or structure was likely moved. There is lots of noise and false positives. But the algorithm does very well in areas of significant change.
 |
| BAM! Change detection! Click for larger version |
How it works...
If a building is added in the new image, it will be brighter than its surroundings. If a building is removed, the new image will be darker in that area. The same holds true for vegetation, to some extent.Here is a close up of an area of intense change that demonstrates what we're talking about. In the following image, a single softball field was expanded into an entire softball field complex. In the upper left of the image you can see where the trees were cleared and bright-green grass and dirt infields were added. In the purple area in the lower right of the image you can see where the original field was rotated. Further in that direction, you can see some of the noise where the intensity changed between the images but it doesn't have much meaning. However if you zoomed out, the areas of significant change stand out very clearly which is usually the point of this kind of analysis:
 |
| Looking at these softball fields close up really shows what's happening. Click for larger version |
No comments:
Post a Comment