 Converting a shapefile into an image has two common uses. The first is in web mapping servers. All data in the map is fused into an image which is then optionally tiled and cached at different scales. This method is how Google Maps, ESRI ArcGIS Server, and UMN Mapserver all work. UMN Mapserver even includes a command-line utility called "Shp2Image" which converts its "mapscript" configuration file into an image for quick testing. The second common reason to convert a shapefile into an image is to use it as a mask to clip remotely-sensed imagery. In both cases most geospatial software packages handle these operations for you behind the scenes.
The very simple script below shows you how you can rasterize a shapefile using the Python Shapefile Library (PSL) and the Python Imaging Library (PIL). PIL is a very old and well-developed library originally created to process remote sensing imagery however it has absolutely no spatial capability. What it does have is the ability to read and write multiple image formats and can handle very large images. It also has an API that lets you easily import and export data to and from other libraries using python strings and arrays. The PIL ImageDraw module provides an easy way to draw on an image canvas.
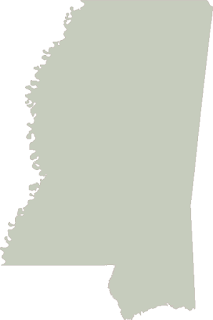
The following script reads in a shapefile, grabs the points from the first and only polygon, draws them to an image, and then saves the image as a PNG file with an accompanying .pgw world file to make it a geospatial image. Most modern GIS packages handle PNG images but you could just as easily change the file and worldfile extension to jpg and jgw respectively for even better compatibility. As usual I created minimal variables to keep the code short and as easy to understand as possible.
import shapefile
import Image, ImageDraw

# Read in a shapefile
r = shapefile.Reader("mississippi")
# Geographic x & y distance
xdist = r.bbox[2] - r.bbox[0]
ydist = r.bbox[3] - r.bbox[1]
# Image width & height
iwidth = 400
iheight = 600
xratio = iwidth/xdist
yratio = iheight/ydist
pixels = []
for x,y in r.shapes()[0].points:
  px = int(iwidth - ((r.bbox[2] - x) * xratio))
  py = int((r.bbox[3] - y) * yratio)
  pixels.append((px,py))
img = Image.new("RGB", (iwidth, iheight), "white")
draw = ImageDraw.Draw(img)
draw.polygon(pixels, outline="rgb(203, 196, 190)",
                fill="rgb(198, 204, 189)")
img.save("mississippi.png")

# Create a world file
wld = file("mississippi.pgw", "w")
wld.write("%s\n" % (xdist/iwidth))
wld.write("0.0\n")
wld.write("0.0\n")
wld.write("-%s\n" % (ydist/iheight))
wld.write("%s\n" % r.bbox[0])
wld.write("%s\n" % r.bbox[3])
wld.close
You can download this script here:
http://geospatialpython.googlecode.com/svn/trunk/shp2img.py
You can download the shapefile used here:
http://geospatialpython.googlecode.com/files/Mississippi.zip
Of course you will also need the Python Shapefile Library found here and the latest version of the Python Imaging Library from here.
The image created by this script is featured at the top of this post.
The idea of using a shapefile as a clipping mask for an image can be done with GDAL. The python API for GDAL includes integration with the well-known Python Numeric (NumPy) package using a module called "gdalnumeric". Both gdalnumeric and PIL contain "tostring" and "fromstring" methods which allow you to move image data back and forth between the packages. GDAL and NumPy make handling geospatial data as numerical arrays easier and PIL's API makes creating a polygon clipping mask much easier.
I'll cover using PIL, GDAL, NumPy, and PSL together in a future post. I'll also demonstrate a way where the above operation can be performed using pure Python.
No comments:
Post a Comment