Pages

Tuesday, February 22, 2011

Clip a Raster using a Shapefile

Clipping a satellite image: Rasterize, Mask, Clip, Save
If you read this blog you see most of the material covers shapefiles.  The intent of this blog is to cover remote sensing as well and this article provides a great foundation for remote sensing in Python. In this post I'll demonstrate how to use several Python libraries to to create a script which can take any polygon shapefile and use it as a mask to clip a geospatial image.  Although I'm demonstrating a fairly basic process, this article and the accompanying sample script is densely-packed with lots of good information and tips that would take you hours if not days to piece together reading forum posts, mailing lists, blogs, and trial and error.  This post will get you well on your way to doing whatever you want to do with Python and Remote Sensing.

Satellite and aerial images are usually collected in square tiles more or less the same way your digital camera frames and captures a picture.  Geospatial images are data capturing different wavelengths of light reflected from known points on the Earth or even other planets.  GIS professionals routinely clip these image tiles to a specific area of interest to provide context for vector layers within a GIS map.  This technique may also be used for remote sensing to narrow down image processing to specific areas to reduce the amount of time it takes to analyze the image.

The Process

Clipping a raster is a series of simple button clicks in high-end geospatial software packages.  In terms of computing, geospatial images are actually very large, multi-dimensional arrays.  Remote Sensing at its simplest is performing mathematical operations on these arrays to extract information from the data. Behind the scenes here is what the software is doing (give or take a few steps):
  1. Convert the vector shapefile to a matrix which can be used as mask
  2. Load the geospatial image into a matrix
  3. Throw out any image cells outside of the shapefile extent
  4. Set all values outside the shapefile boundary to NODATA (null) values
  5. OPTIONAL: Perform a histogram stretch on the image for better visualization
  6. Save the resulting image as a new raster.
Geospatial Python Raster Clipping Workflow
Tools

Two things I try to do on this blog are build on techniques used in previous posts and focus on pure-Python solutions as much as possible.  The script featured in this post will use one of the shapefile rasterization techniques I've written about in the past.  However I did not go pure-Python on this for several reasons.  Geospatial image formats tend to be extremely complex.  You could make a career out of reading and writing the dozens of evolving image formats out there.  As the old saying goes TIFF stands for "Thousands of Incompatible File Formats".  So for this reason I use the Python bindings for GDAL when dealing with geospatial raster data.  The other issue is the size of most geospatial raster data.  Satellite and high-resolution aerial images can easily be in the 10's to 100's of megabytes size range.  Doing math on these images and the memory required to follow the six step process outlined above exceeds the capability of Python's native libraries in many instances.  For this reason I use the Numpy library which is dedicated to large, multi-dimensional matrix math.  Another reason to use Numpy is tight integration with GDAL in the form of the "GDALNumeric" module. (Numeric was the predecessor to Numpy) In past posts I showed a pure-Python way to rasterize a shapefile.  However I use the Python Imaging Library (PIL) in this example because it provides convenient methods to move data back and forth between Numpy.

Library Installation

So in summary you will need to install the following packages to make the sample script work.  Usually the Python Disutils system (i.e. the "easy_install" script) is the fastest and simplest way to install a Python library.  Because of the complexity and dependencies of some of these tools you may need to track down a pre-compiled binary for your platform.  Both Numpy and GDAL have them linked from their respective websites or the Python Package Index.

The Example

# RasterClipper.py - clip a geospatial image using a shapefile

import operator
from osgeo import gdal, gdalnumeric, ogr, osr
import Image, ImageDraw

# Raster image to clip
raster = "SatImage.tif"

# Polygon shapefile used to clip
shp = "county"

# Name of clip raster file(s)
output = "clip"

# This function will convert the rasterized clipper shapefile 
# to a mask for use within GDAL.    
def imageToArray(i):
    """
    Converts a Python Imaging Library array to a 
    gdalnumeric image.
    """
    a=gdalnumeric.fromstring(i.tostring(),'b')
    a.shape=i.im.size[1], i.im.size[0]
    return a

def arrayToImage(a):
    """
    Converts a gdalnumeric array to a 
    Python Imaging Library Image.
    """
    i=Image.fromstring('L',(a.shape[1],a.shape[0]),
            (a.astype('b')).tostring())
    return i
     
def world2Pixel(geoMatrix, x, y):
  """
  Uses a gdal geomatrix (gdal.GetGeoTransform()) to calculate
  the pixel location of a geospatial coordinate 
  """
  ulX = geoMatrix[0]
  ulY = geoMatrix[3]
  xDist = geoMatrix[1]
  yDist = geoMatrix[5]
  rtnX = geoMatrix[2]
  rtnY = geoMatrix[4]
  pixel = int((x - ulX) / xDist)
  line = int((ulY - y) / yDist)
  return (pixel, line) 

def histogram(a, bins=range(0,256)):
  """
  Histogram function for multi-dimensional array.
  a = array
  bins = range of numbers to match 
  """
  fa = a.flat
  n = gdalnumeric.searchsorted(gdalnumeric.sort(fa), bins)
  n = gdalnumeric.concatenate([n, [len(fa)]])
  hist = n[1:]-n[:-1] 
  return hist

def stretch(a):
  """
  Performs a histogram stretch on a gdalnumeric array image.
  """
  hist = histogram(a)
  im = arrayToImage(a)   
  lut = []
  for b in range(0, len(hist), 256):
    # step size
    step = reduce(operator.add, hist[b:b+256]) / 255
    # create equalization lookup table
    n = 0
    for i in range(256):
      lut.append(n / step)
      n = n + hist[i+b]
  im = im.point(lut)
  return imageToArray(im)

# Load the source data as a gdalnumeric array
srcArray = gdalnumeric.LoadFile(raster)

# Also load as a gdal image to get geotransform 
# (world file) info
srcImage = gdal.Open(raster)
geoTrans = srcImage.GetGeoTransform()

# Create an OGR layer from a boundary shapefile
shapef = ogr.Open("%s.shp" % shp)
lyr = shapef.GetLayer(shp)
poly = lyr.GetNextFeature()

# Convert the layer extent to image pixel coordinates
minX, maxX, minY, maxY = lyr.GetExtent()
ulX, ulY = world2Pixel(geoTrans, minX, maxY)
lrX, lrY = world2Pixel(geoTrans, maxX, minY)

# Calculate the pixel size of the new image
pxWidth = int(lrX - ulX)
pxHeight = int(lrY - ulY)

clip = srcArray[:, ulY:lrY, ulX:lrX]

# Create a new geomatrix for the image
geoTrans = list(geoTrans)
geoTrans[0] = minX
geoTrans[3] = maxY

# Map points to pixels for drawing the 
# boundary on a blank 8-bit, 
# black and white, mask image.
points = []
pixels = []
geom = poly.GetGeometryRef()
pts = geom.GetGeometryRef(0)
for p in range(pts.GetPointCount()):
  points.append((pts.GetX(p), pts.GetY(p)))
for p in points:
  pixels.append(world2Pixel(geoTrans, p[0], p[1]))
rasterPoly = Image.new("L", (pxWidth, pxHeight), 1)
rasterize = ImageDraw.Draw(rasterPoly)
rasterize.polygon(pixels, 0)
mask = imageToArray(rasterPoly)   

# Clip the image using the mask
clip = gdalnumeric.choose(mask, \
    (clip, 0)).astype(gdalnumeric.uint8)

# This image has 3 bands so we stretch each one to make them
# visually brighter
for i in range(3):
  clip[i,:,:] = stretch(clip[i,:,:])

# Save ndvi as tiff
gdalnumeric.SaveArray(clip, "%s.tif" % output, \
    format="GTiff", prototype=raster)

# Save ndvi as an 8-bit jpeg for an easy, quick preview
clip = clip.astype(gdalnumeric.uint8)
gdalnumeric.SaveArray(clip, "%s.jpg" % output, format="JPEG")

Tips and Further Reading

The utility functions at the beginning of this script are useful whenever you are working with remotely sensed data in Python using GDAL, PIL, and Numpy.

If you're in a hurry be sure to look at the GDAL utility programs.  This collection has a tool for just about any simple operation including clipping a raster to a rectangle.  Technically you could accomplish the above polygon clip using only GDAL utilities but for complex operations like this Python is much easier.

The data referenced in the above script are a shapefile and a 7-4-1 Path 22, Row 39 Landsat image from 2006. You can download the data and the above sample script from the GeospatialPython Google Code project here.

I would normally use the Python Shapefile Library to grab the polygon shape instead of OGR but because I used GDAL, OGR is already there. So why bother with another library?

If you are going to get serious about Remote Sensing and Python you should check out OpenEV.  This package is a complete remote sensing platform including an ERDAS Imagine-style viewer.  It comes with all the GDAL tools, mapserver and tools, and a ready-to-run Python environment.

I've written about it before but Spectral Python is worth a look and worth mentioning again. I also recently found PyResample on Google Code but I haven't tried it yet.  

Beyond the above you will find bits and pieces of Python remote sensing code scattered around the web.  Good places to look are:
More to come!

UPDATE (May 4, 2011): I usually provide a link to example source code and data for instructional posts. I set up the download for this one but forgot to post it.  This zip file contains everything you need to perform the example above except the installation of GDAL, Numpy, and PIL:
http://geospatialpython.googlecode.com/files/clipraster.zip

Make sure the required libraries are installed and working before you attempt this example.  As I mention above the OpenEV package has a Python environment with all required packages except PIL.  It may take a little work to get PIL into this unofficial Python environment but in my experience it's less work than wrangling GDAL into place.

Saturday, February 12, 2011

Create a .prj Projection File for a Shapefile

An example of a cordiform map projection a.k.a. 
heart-shaped projection
. Happy Valentine's!
If you create a shapefile with ESRI software or receive one from someone who did you may see a ".prj" file included along with the shp, shx, and dbf files.  In fact, the prj file is one of up to 9 possible "official" file extensions for various indexes and other meta files.  Most of these file formats are proprietary.  There are an additional two formats created by the open source community to work around the closed formats created by ESRI for spatial indexing.

The shapefile format does not allow for specifying the map projection of the data. When ESRI created the shapefile format everyone worked with data in only one projection. If you tried to load a layer in a different projection into your GIS weird things would happen.  Not too long ago as hardware capability increased according to Moore's Law, GIS software packages developed the ability to reproject geospatial layers on the fly.  You could now load in layers in any projection and as long as you told the software what projections were involved the map would come together nicely.

ArcGIS 8.x allowed you to manually assign each layer a projection.  This information was stored in the prj file.  The prj file contains a WKT (Well-Known Text) string which has all the parameters for the map projection. So the format is quite simple and was created by the Open GIS Consortium.

But there are several thousand "commonly-used" map projections which were standardized by the European Survey Petroleum Group (EPSG). And there's no way to accurately detect the projection from the coordinates in the shapefile. For these reasons the Python Shapefile Library does not currently handle prj files.

If you need a prj file, the easiest thing to do is write one yourself. The following example creates a simple point shapefile and then the corresponding prj file using the WGS84 "unprojected" WKT.

import shapefile as sf
filename = 'test/point'

# create the shapefile
w = sf.Writer(sf.POINT)
w.point(37.7793, -122.4192)
w.field('FIRST_FLD')
w.record('First','Point')
w.save(filename)

# create the PRJ file
prj = open("%s.prj" % filename, "w")
epsg = 'GEOGCS["WGS 84",'
epsg += 'DATUM["WGS_1984",'
epsg += 'SPHEROID["WGS 84",6378137,298.257223563]]'
epsg += ',PRIMEM["Greenwich",0],'
epsg += 'UNIT["degree",0.0174532925199433]]'
prj.write(epsg)
prj.close()

I've thought about adding the ability to optionally write prj files but the list of "commonly-used" WKT strings is over .5 megs and would be bigger than the shapefile library itself.  I may eventually work something out though.

The easiest thing to do right now is just figure out what WKT string you need for your data and write a file after you save your shapefile. If you need a list of map projection names, epsg codes, and corresponding WKT strings you can download it from the geospatialpython Github "Learn" repository here.

A word of warning if you are new to GIS and shapefiles: the prj file is just metadata about your shapefile.  Changing the projection reference in the prj file will not change the actual projection of the geometry and will just confuse your GIS software.

Thursday, February 10, 2011

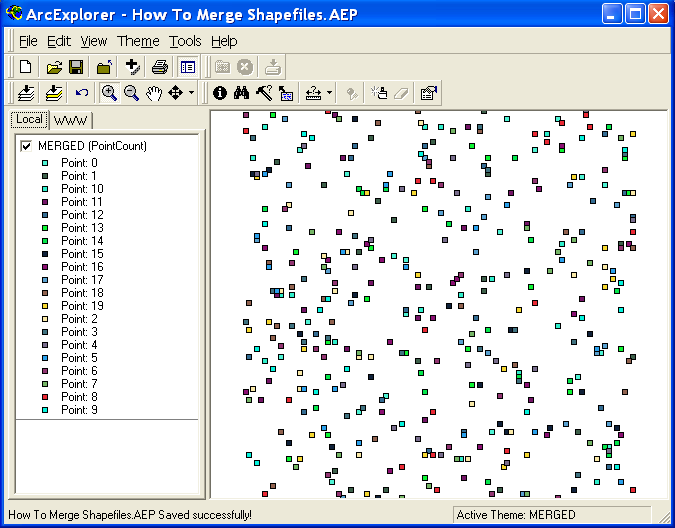
Merging Lots of Shapefiles (quickly)

Arne, over at GIS-Programming.com, recently posted about merging shapefiles using a batch process. I can't remember the last time I merged two or more shapefiles but after googling around it is a very common use case.  GIS forums are littered with requests for the best way to batch merge a directory full of files.  My best guess is people have to work with automatically-generated, geographically disperse data with a common projection and database schema.  I imagine these files would be the result of some automated sensor output. If you know some use cases requiring merging many shapefiles I'd be curious to hear about it.

Arne pointed out that all the code samples out there iterate through each feature in a shapefile and add them to the merged file.  He says this method is slow. I agree to an extent (no pun intended).  However, at some point the underlying shapefile library MUST iterate through each feature in order to generate the summary information, namely the bounding box, required to write a valid shapefile header.  But it is theoretically slightly more efficient to wait until the merge is finished so there is only one iteration cycle.  At the very least, waiting till the end requires less code.

The following example merges all the shapefiles in the current directory into one file and it is quite fast.

# Merge a bunch of shapefiles with attributes quickly!
import glob
import shapefile
files = glob.glob("*.shp")
w = shapefile.Writer()
for f in files:
  r = shapefile.Reader(f)
  w._shapes.extend(r.shapes())
  w.records.extend(r.records())
w.fields = list(r.fields)
w.save("merged")

Wednesday, February 2, 2011

Python 3 Version of the Python Shapefile Library Released

I created a "hasty" port of the Python Shapefile Library to Python 3 at the request of a developer.  You can download it from the Subversion repository at the "pyshp" project on Google Code.  You will now find the subversion trunk contains "Python 2" and "Python 3" folders.  The documentation available in the "Downloads" section of the project site contains two sets of documentation now as well.  The Python 3 version is tagged with "Py3".

The versions function identically however the "Editor" class is broken in the Python 3 version and this issue is documented in the instructions and the code.  This class is not necessary to read and write shapefiles. It is just a convenience class and will be fixed in a future version.  I have only made the Py 3 version pass the doctests - nothing more.  So bug reports are welcome.

I also plan to make the Python 2 version compatible with Jython.  Initial testing shows that it too works except for the Editor class.  I'd appreciate any feedback if you are using it on that platform.  The same applies to IronPython and even PythonCE which I haven't tested at all.

Because of the reorganization of the source tree many of the links on previous posts may be broken.  I should have these repaired shortly. [UPDATE: All links have been corrected 2/11/11]

Both versions will be updated and maintained indefinitely as it will probably take several years for Python 3 to become mainstream - especially in the geospatial community. Many, many geospatial libraries will require porting to 3.  I used the "2to3" script but found that most of the work was in casting strings and byte arrays which is no longer implicit.  The library packs and unpacks data constantly so this change had a huge impact on the shapefile library.  Python 2 made it easy to be lazy with data types.

Wednesday, January 19, 2011

Point in Polygon

The Ray Casting Method tests if a point is inside a polygon.
UPDATE: There's a newer version of this algorithm that accounts for points that fall on the boundary of a polygon which are included as inside the polygon. The title is "Point in Polygon 2: Walking the line" and was published Aug. 23, 2011.

A fundamental geospatial operation is checking to see if a point is inside a polygon.  This one operation is the atomic building block of many, many different types of spatial queries.  This operation seems deceptively simple because it's so easy to see and comprehend visually. But doing this check computationally gets quite complex.

At first glance there are dozens of algorithms addressing this challenge.  However they all have special cases where they fail.  The failures come from the infinite number of ways polygons can form which ultimately foil any sort of systematic check.  For a programmer the choice comes down to a compromise between computational efficiency (i.e. speed in this case) and thoroughness (i.e. how rare the exceptions are).

The best solution to this issue I've found is the "Ray Casting Method".  The idea is you start drawing an imaginary line from the point in question and stop drawing it when the line leaves the polygon bounding box. Along the way you count the number of times you crossed the polygon's boundary.  If the count is an odd number the point must be inside.  If it's an even number the point is outside the polygon.  So in summary, odd=in, even=out - got it?

This algorithm is fast and is accurate.  In fact, pretty much the only way you can stump it is if the point is ridiculously close to the polygon boundary where a rounding error would merge the point with the boundary.  In that case you can just blame your programming language and switch to Python.

I had no intention of implementing this algorithm myself so I googled several options, tried them out, and found a winner.  It's interesting but not surprising that most of the spatial algorithms I find and use come from computer graphics sites, usually gaming sites or computer vision sites, as opposed to geospatial sites.  My favorite ray casting point-in-polygon sample came from the "Simple Machine Forum" at "PSE Entertainment Corp".  It was posted by their anonymous webmaster.

# Determine if a point is inside a given polygon or not
# Polygon is a list of (x,y) pairs. This function
# returns True or False.  The algorithm is called
# the "Ray Casting Method".

def point_in_poly(x,y,poly):

    n = len(poly)
    inside = False

    p1x,p1y = poly[0]
    for i in range(n+1):
        p2x,p2y = poly[i % n]
        if y > min(p1y,p2y):
            if y <= max(p1y,p2y):
                if x <= max(p1x,p2x):
                    if p1y != p2y:
                        xints = (y-p1y)*(p2x-p1x)/(p2y-p1y)+p1x
                    if p1x == p2x or x <= xints:
                        inside = not inside
        p1x,p1y = p2x,p2y

    return inside

## Test

polygon = [(0,10),(10,10),(10,0),(0,0)]

point_x = 5
point_y = 5

## Call the function with the points and the polygon
print point_in_poly(point_x,point_y,polygon)

Easy to read, easy to use.  In a previous post on creating a dot density profile, I used the "contains" method in OGR to check randomly-generated points representing population counts against US Census Bureau tracts.  That script created a point shapefile which could then be added as a layer.  It worked great but it wasn't pure python because of OGR.  The other problem with that recipe is creating a shapefile is overkill as dot density maps are just a visualization.

I decided to build on some other posts to combine this ray casting method, PNGCanvas, and the Python Shapefile Library to create a lightweight, pure Python dot density map implementation. The following code reads in a shapefile of census tracts, looks at the population value for that tract, then randomly draws a dot within that census tract for every 50 people.  The census tract boundaries are also added to the resulting PNG image.  The conventional wisdom, especially in the geospatial world, states if you need to do a large number of costly calculations it's worth using C because Python will be much slower.  To my surprise the pure Python version was just about as quick as the OGR version.  I figured the point-in-polygon calculation would be the most costly part.  The results are close enough to warrant further detailed profiling which I'll do at some point.  But regardless this operation is much, much quicker in pure Python than I expected.

import random
import shapefile
import pngcanvas

def pip(x,y,poly):
    n = len(poly)
    inside = False
    p1x,p1y = poly[0]
    for i in range(n+1):
        p2x,p2y = poly[i % n]
        if y > min(p1y,p2y):
            if y <= max(p1y,p2y):
                if x <= max(p1x,p2x):
                    if p1y != p2y:
                        xints = (y-p1y)*(p2x-p1x)/(p2y-p1y)+p1x
                    if p1x == p2x or x <= xints:
                        inside = not inside
        p1x,p1y = p2x,p2y
    return inside

# Source shapefile - can be any polygon
r = shapefile.Reader("GIS_CensusTract_poly.shp")

# pixel to coordinate info
xdist = r.bbox[2] - r.bbox[0]
ydist = r.bbox[3] - r.bbox[1]
iwidth = 600
iheight = 500
xratio = iwidth/xdist
yratio = iheight/ydist

c = pngcanvas.PNGCanvas(iwidth,iheight,color=[255,255,255,0xff])

# background color
c.filledRectangle(0,0,iwidth,iheight)

# Pen color
c.color = [139,137,137,0xff]

# Draw the polygons 
for shape in r.shapes():
  pixels = []
  for x,y in shape.points:  
    px = int(iwidth - ((r.bbox[2] - x) * xratio))
    py = int((r.bbox[3] - y) * yratio)
    pixels.append([px,py])
  c.polyline(pixels)

rnum = 0
trnum = len(r.shapeRecords())
for sr in r.shapeRecords():
  rnum += 1
  #print rnum, " of ", trnum
  density = sr.record[20]
  total = int(density / 50)
  count = 0
  minx, miny, maxx, maxy = sr.shape.bbox   
  while count < total:    
    x = random.uniform(minx,maxx)
    y = random.uniform(miny,maxy)    
    if pip(x,y,sr.shape.points):
      count += 1
      #print " ", count, " of ", total
      px = int(iwidth - ((r.bbox[2] - x) * xratio))
      py = int((r.bbox[3] - y) * yratio)
      c.point(px,py,color=[255,0,0,0xff])

f = file("density_pure.png", "wb")
f.write(c.dump())
f.close()

The shapefile used above can be found here.

You can download PNGCanvas here.

And the Python Shapefile Library is here.