 | |
| Clipping a satellite image: Rasterize, Mask, Clip, Save |
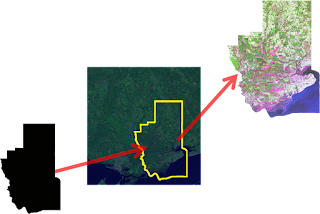
Satellite and aerial images are usually collected in square tiles more or less the same way your digital camera frames and captures a picture. Geospatial images are data capturing different wavelengths of light reflected from known points on the Earth or even other planets. GIS professionals routinely clip these image tiles to a specific area of interest to provide context for vector layers within a GIS map. This technique may also be used for remote sensing to narrow down image processing to specific areas to reduce the amount of time it takes to analyze the image.
The Process
Clipping a raster is a series of simple button clicks in high-end geospatial software packages. In terms of computing, geospatial images are actually very large, multi-dimensional arrays. Remote Sensing at its simplest is performing mathematical operations on these arrays to extract information from the data. Behind the scenes here is what the software is doing (give or take a few steps):
- Convert the vector shapefile to a matrix which can be used as mask
- Load the geospatial image into a matrix
- Throw out any image cells outside of the shapefile extent
- Set all values outside the shapefile boundary to NODATA (null) values
- OPTIONAL: Perform a histogram stretch on the image for better visualization
- Save the resulting image as a new raster.
 |
| Geospatial Python Raster Clipping Workflow |
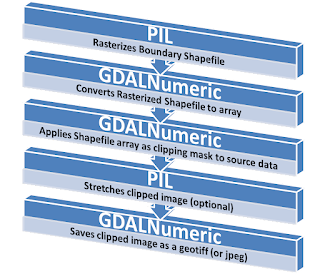
Two things I try to do on this blog are build on techniques used in previous posts and focus on pure-Python solutions as much as possible. The script featured in this post will use one of the shapefile rasterization techniques I've written about in the past. However I did not go pure-Python on this for several reasons. Geospatial image formats tend to be extremely complex. You could make a career out of reading and writing the dozens of evolving image formats out there. As the old saying goes TIFF stands for "Thousands of Incompatible File Formats". So for this reason I use the Python bindings for GDAL when dealing with geospatial raster data. The other issue is the size of most geospatial raster data. Satellite and high-resolution aerial images can easily be in the 10's to 100's of megabytes size range. Doing math on these images and the memory required to follow the six step process outlined above exceeds the capability of Python's native libraries in many instances. For this reason I use the Numpy library which is dedicated to large, multi-dimensional matrix math. Another reason to use Numpy is tight integration with GDAL in the form of the "GDALNumeric" module. (Numeric was the predecessor to Numpy) In past posts I showed a pure-Python way to rasterize a shapefile. However I use the Python Imaging Library (PIL) in this example because it provides convenient methods to move data back and forth between Numpy.
Library Installation
So in summary you will need to install the following packages to make the sample script work. Usually the Python Disutils system (i.e. the "easy_install" script) is the fastest and simplest way to install a Python library. Because of the complexity and dependencies of some of these tools you may need to track down a pre-compiled binary for your platform. Both Numpy and GDAL have them linked from their respective websites or the Python Package Index.
The Example
# RasterClipper.py - clip a geospatial image using a shapefile

import operator
from osgeo import gdal, gdalnumeric, ogr, osr
import Image, ImageDraw

# Raster image to clip
raster = "SatImage.tif"

# Polygon shapefile used to clip
shp = "county"

# Name of clip raster file(s)
output = "clip"

# This function will convert the rasterized clipper shapefile
# to a mask for use within GDAL.
def imageToArray(i):
    """
    Converts a Python Imaging Library array to a
    gdalnumeric image.
    """
    a=gdalnumeric.fromstring(i.tostring(),'b')
    a.shape=i.im.size[1], i.im.size[0]
    return a

def arrayToImage(a):
    """
    Converts a gdalnumeric array to a
    Python Imaging Library Image.
    """
    i=Image.fromstring('L',(a.shape[1],a.shape[0]),
            (a.astype('b')).tostring())
    return i

def world2Pixel(geoMatrix, x, y):
  """
  Uses a gdal geomatrix (gdal.GetGeoTransform()) to calculate
  the pixel location of a geospatial coordinate
  """
  ulX = geoMatrix[0]
  ulY = geoMatrix[3]
  xDist = geoMatrix[1]
  yDist = geoMatrix[5]
  rtnX = geoMatrix[2]
  rtnY = geoMatrix[4]
  pixel = int((x - ulX) / xDist)
  line = int((ulY - y) / yDist)
  return (pixel, line)

def histogram(a, bins=range(0,256)):
  """
  Histogram function for multi-dimensional array.
  a = array
  bins = range of numbers to match
  """
  fa = a.flat
  n = gdalnumeric.searchsorted(gdalnumeric.sort(fa), bins)
  n = gdalnumeric.concatenate([n, [len(fa)]])
  hist = n[1:]-n[:-1]
  return hist

def stretch(a):
  """
  Performs a histogram stretch on a gdalnumeric array image.
  """
  hist = histogram(a)
  im = arrayToImage(a)
  lut = []
  for b in range(0, len(hist), 256):
    # step size
    step = reduce(operator.add, hist[b:b+256]) / 255
    # create equalization lookup table
    n = 0
    for i in range(256):
      lut.append(n / step)
      n = n + hist[i+b]
  im = im.point(lut)
  return imageToArray(im)

# Load the source data as a gdalnumeric array
srcArray = gdalnumeric.LoadFile(raster)

# Also load as a gdal image to get geotransform
# (world file) info
srcImage = gdal.Open(raster)
geoTrans = srcImage.GetGeoTransform()

# Create an OGR layer from a boundary shapefile
shapef = ogr.Open("%s.shp" % shp)
lyr = shapef.GetLayer(shp)
poly = lyr.GetNextFeature()

# Convert the layer extent to image pixel coordinates
minX, maxX, minY, maxY = lyr.GetExtent()
ulX, ulY = world2Pixel(geoTrans, minX, maxY)
lrX, lrY = world2Pixel(geoTrans, maxX, minY)

# Calculate the pixel size of the new image
pxWidth = int(lrX - ulX)
pxHeight = int(lrY - ulY)

clip = srcArray[:, ulY:lrY, ulX:lrX]

# Create a new geomatrix for the image
geoTrans = list(geoTrans)
geoTrans[0] = minX
geoTrans[3] = maxY

# Map points to pixels for drawing the
# boundary on a blank 8-bit,
# black and white, mask image.
points = []
pixels = []
geom = poly.GetGeometryRef()
pts = geom.GetGeometryRef(0)
for p in range(pts.GetPointCount()):
  points.append((pts.GetX(p), pts.GetY(p)))
for p in points:
  pixels.append(world2Pixel(geoTrans, p[0], p[1]))
rasterPoly = Image.new("L", (pxWidth, pxHeight), 1)
rasterize = ImageDraw.Draw(rasterPoly)
rasterize.polygon(pixels, 0)
mask = imageToArray(rasterPoly)

# Clip the image using the mask
clip = gdalnumeric.choose(mask, \
    (clip, 0)).astype(gdalnumeric.uint8)

# This image has 3 bands so we stretch each one to make them
# visually brighter
for i in range(3):
  clip[i,:,:] = stretch(clip[i,:,:])

# Save ndvi as tiff
gdalnumeric.SaveArray(clip, "%s.tif" % output, \
    format="GTiff", prototype=raster)

# Save ndvi as an 8-bit jpeg for an easy, quick preview
clip = clip.astype(gdalnumeric.uint8)
gdalnumeric.SaveArray(clip, "%s.jpg" % output, format="JPEG")
Tips and Further Reading
The utility functions at the beginning of this script are useful whenever you are working with remotely sensed data in Python using GDAL, PIL, and Numpy.
If you're in a hurry be sure to look at the GDAL utility programs. This collection has a tool for just about any simple operation including clipping a raster to a rectangle. Technically you could accomplish the above polygon clip using only GDAL utilities but for complex operations like this Python is much easier.
The data referenced in the above script are a shapefile and a 7-4-1 Path 22, Row 39 Landsat image from 2006. You can download the data and the above sample script from the GeospatialPython Google Code project here.
I would normally use the Python Shapefile Library to grab the polygon shape instead of OGR but because I used GDAL, OGR is already there. So why bother with another library?
If you are going to get serious about Remote Sensing and Python you should check out OpenEV. This package is a complete remote sensing platform including an ERDAS Imagine-style viewer. It comes with all the GDAL tools, mapserver and tools, and a ready-to-run Python environment.
I've written about it before but Spectral Python is worth a look and worth mentioning again. I also recently found PyResample on Google Code but I haven't tried it yet.
Beyond the above you will find bits and pieces of Python remote sensing code scattered around the web. Good places to look are:
More to come!
UPDATE (May 4, 2011): I usually provide a link to example source code and data for instructional posts. I set up the download for this one but forgot to post it. This zip file contains everything you need to perform the example above except the installation of GDAL, Numpy, and PIL:
http://geospatialpython.googlecode.com/files/clipraster.zip
Make sure the required libraries are installed and working before you attempt this example. As I mention above the OpenEV package has a Python environment with all required packages except PIL. It may take a little work to get PIL into this unofficial Python environment but in my experience it's less work than wrangling GDAL into place.

