 |
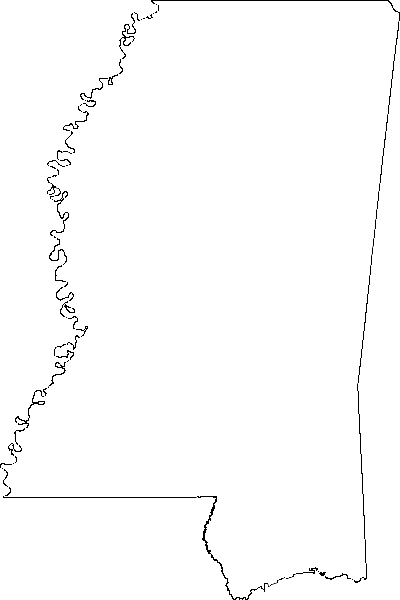
| Rasterized shapefile output by PNGCanvas |
As I mentioned in the other post this functionality is the basis for web mapping servers but could also be used to quickly generate image renderings of shapefiles for documents, presentations, e-mail, or metadata catalogs.
You'll notice this script is very similar to the PIL script I posted. Swapping out PIL with PNGCanvas required minimal changes. As I did last time I also create a world file which allows this image to be layered in most GIS systems albeit only at a single scale.
import shapefile
import pngcanvas

# Read in a shapefile and write png image
r = shapefile.Reader("mississippi")
xdist = r.bbox[2] - r.bbox[0]
ydist = r.bbox[3] - r.bbox[1]
iwidth = 400
iheight = 600
xratio = iwidth/xdist
yratio = iheight/ydist
pixels = []
#
# Only using the first shape record
for x,y in r.shapes()[0].points:
  px = int(iwidth - ((r.bbox[2] - x) * xratio))
  py = int((r.bbox[3] - y) * yratio)
  pixels.append([px,py])
c = pngcanvas.PNGCanvas(iwidth,iheight)
c.polyline(pixels)
f = file("mississippi.png","wb")
f.write(c.dump())
f.close()
#
# Create a world file
wld = file("mississippi.pgw", "w")
wld.write("%s\n" % (xdist/iwidth))
wld.write("0.0\n")
wld.write("0.0\n")
wld.write("-%s\n" % (ydist/iheight))
wld.write("%s\n" % r.bbox[0])
wld.write("%s\n" % r.bbox[3])
wld.close
You can download the shapefile used in this example here:
http://geospatialpython.googlecode.com/files/Mississippi.zip
You can download the script featured above here:
http://geospatialpython.googlecode.com/svn-history/r5/trunk/PureShp2Img.py
No comments:
Post a Comment